
Initial Results from the Data Quest Teams
The 2019/2020 bushfire season was unprecedented in scale, driven by drought and cyclic weather patterns adding to the overall trend of anthropomorphic climate heating. Future fire seasons worldwide are predicted to become more extreme and start earlier. Indeed, the 2020/2021 fire season in NSW and NT has already started. In Australia and New Zealand we are watching the devastation of the fires currently engulfing parts of the United States. Fires on the west coast of the USA are some of the most destructive in history, while other, less-well-known fires have recently caused significant issues in Indonesia. Such events are set to become a common feature of summer around the globe and we must prepare to mitigate the worst effects. The Bushfire Data Quest aims to investigate the solvability of challenge questions using machine learning and remote sensing data. These techniques will add to, and compliment, other approaches for managing fire in the landscape.

Locations of wildland fires in the USA, tracked by https://www.fireweatheravalanche.org/fire/
The four Data Quest teams have made superb progress during the weeks of the research sprint. In a relatively short time they have:
Built software pipelines to ingest multi-dimensional satellite imagery, weather data and terrain models.
Prepared the data for analysis in machine learning workflows.
Refined the focus of the challenge questions and assimilated prior research.
Used advanced algorithms to investigate the ’solvability’ of the challenges.
The teams will present their results on September 16th at 2:30pm AEST during a live-streamed showcase, but before then, here is a quick look at what each of the teams got up to.
Fuels I Team:
The Fuels I Team took on the difficult challenge of creating a better map of live fuel moisture content (LFMC). Current state-of-the-art is the Australian Flammability Monitoring System (AFMS) based on MODIS data, which has a resolution of 500-meters. ESA’s Sentinel-2 satellite photographs Australia every five days at a resolution of 10-60 metres and a map of LFMC based on this data would be game-changing for predicting bushfire behaviour. Complementary radar data from the Sentinel-1 sister satellite has the unique capability to see through clouds and penetrate forest canopy to estimate LFMC.
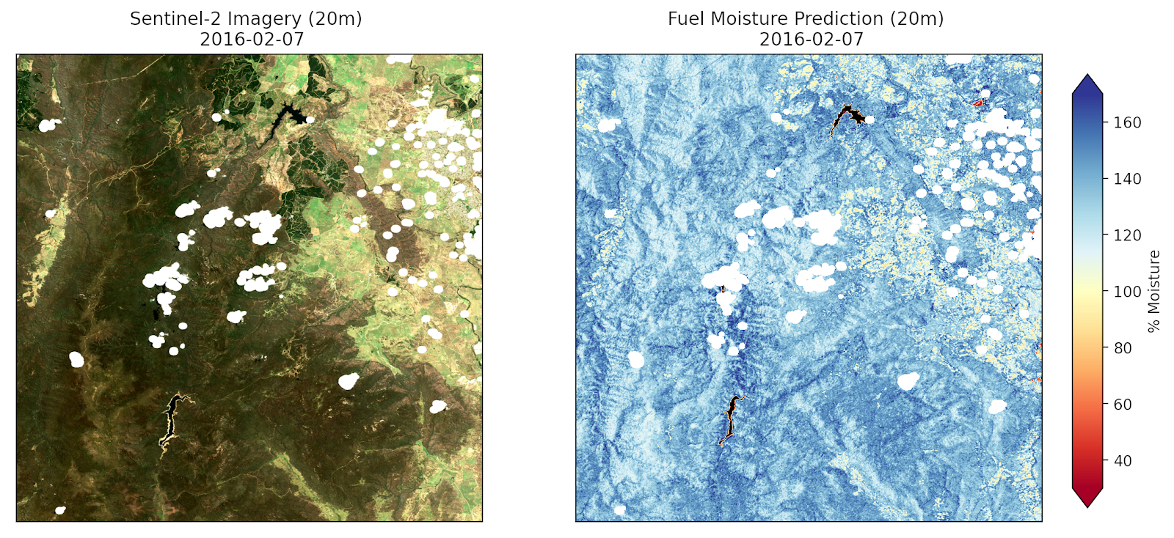
True-colour image from the Sentinel-2 (left) and predicted live fuel moisture content (right). The false-colour scale shows high-moisture areas in blue and low moisture areas in orange. As might be expected from the green colour of the optical image, very little of this landscape is at risk of burning. However, the accuracy of the result is intimately tied to the ground-truth measurements. Many more of these are needed to create a map suitable for modelling fire risk on small scales.
The team developed a workflow that successfully combined Sentinel-2 optical data and Sentinel-1 radar data for Australia to make a map of LFMC tied directly to ground-truth measurements. These ground truth measurements turned out to be critical to building an accurate map and the team identified a major data gap in Australia. Direct measurements of live fuel moisture content are missing from the modern satellite era. One major recommendation might be to engage citizen scientists all over Australia to measure LFMC - this can be as simple as baking some leaves in your oven and measuring the weight lost.
Next post - Results from the Early Detection Team.